Alternate Lines Are Basically Stock Options
If a moneyline bet is like buying a stock, then alternate spreads are the options chain: the same game, a row of different "strike prices," each with a different chance to hit and a different payout. We built a free board that prices every rung. Here's what that means in plain English.
First, a 20-second refresher
A spread is the points cushion. "Nuggets −3.5" means the Nuggets have to win by 4 or more for that bet to cash. The odds next to it (like −110) are just the price, and every price hides a percentage: the chance the book thinks it'll happen. We call that the implied probability. −110 is about 52%. That's the whole vocabulary you need here.
So what's an "alternate" line?
Same bet, different number. Instead of being stuck with Nuggets −3.5, the book also lets you take:
- Nuggets −1.5 — easier to win, but it pays less.
- Nuggets −7.5 — harder to win, but it pays more.
- Nuggets +2.5 — now you're getting points, even safer, pays even less.
Line them all up and you've got a ladder of the same bet at a dozen prices. Sound familiar? That's exactly what a stock options chain is: one stock, a column of strike prices, each a different risk-and-reward trade.
The options cheat sheet
If you know options, the map is one-to-one. If you don't, ignore the left column:
| In the market | In sports betting |
|---|---|
| Buying the stock | The moneyline (just pick the winner) |
| Strike price | The points number (−3.5, +7.5…) |
| The premium you pay | The odds (−110, +180…) |
| Out-of-the-money call | A deep favorite line (−9.5): long shot, big payout |
| In-the-money / safe | Taking points (+2.5): high odds to hit, small payout |
| Expiration | The final whistle |
What the board actually shows
Here's a real example from the dashboard. Pick a game, hit "Options," and you get the full ladder for each side:
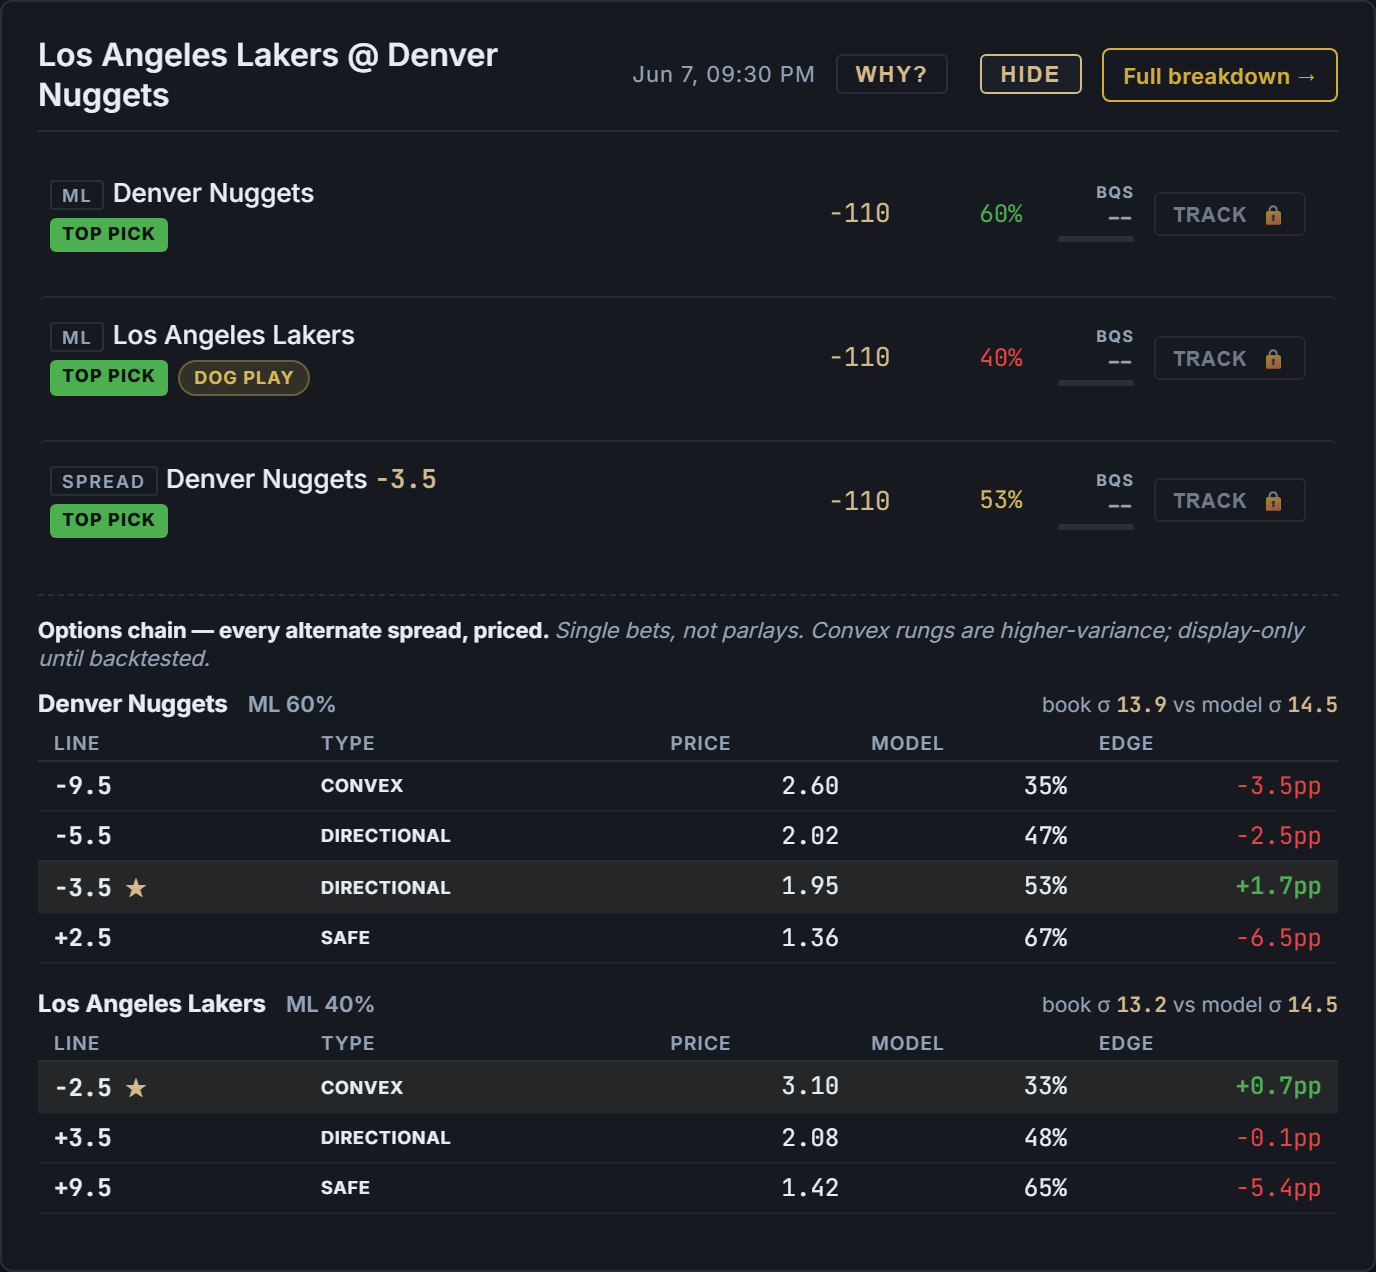
Example only (not a live game). Each row is one alternate spread. "Model" is our estimated chance it cashes; "Edge" is how that compares to the price. Green means the model likes it, red means it doesn't. The starred row is the best of the bunch.
The three tags are just plain-English risk levels:
- SAFE — you're taking points, high chance to win, small payout. The "in-the-money" rung.
- DIRECTIONAL — near the real line, a normal-ish bet.
- CONVEX — the long-shot rung: low chance, big payout, high variance. Fun, but it's the lottery ticket of the ladder.
The one idea that makes this useful
Notice the little line up top of each ladder: "book σ 13.9 vs model σ 14.5." Don't let the symbol scare you. Sigma is just how blowout-y a sport is — how far final margins tend to swing from the average. NBA games swing a lot; baseball run lines barely move.
Here's the trick. To price a deep line like −9.5, the book has to assume how often games turn into blowouts. If the book's assumption is a little off from what actually happens, the lines way out on the ends of the ladder get priced a hair wrong. That gap — the book's blowout guess vs the model's — is the entire reason a rung might be worth a look. It's the sports version of "this option's implied volatility looks cheap."
How to pull it up (free, no signup)
- Go to the main board.
- Click a sport with spreads: NBA, NFL, or MLB.
- If the list looks empty, switch the Verdict filter to "All" so every game shows.
- On any game, click "Options" next to the "Why?" button.
One heads-up: the ladder only fills in once the sportsbook has actually posted alternate lines, which is usually closer to game time. Pick a game starting soon if you want to see the whole thing.
And one rule that doesn't bend: every rung on this board is a single bet. We don't do same-game parlays here. We looked hard at parlays and the math is brutal — stacking legs together is how the house quietly wins. The options idea works on single alternate lines, not combos.